
Data Governance and Quality Management
Analytics is only as trustworthy as the data behind it. This course introduces the practices that keep organisational data accurate, consistent, and well managed, from ownership and standards to quality monitoring.
Course outline
What this programme covers, module by module.
- 01Explaining the purpose and scope of data governance
- 02Assigning data ownership and stewardship responsibilities
- 03Setting standards and shared definitions for key data
- 04Measuring and monitoring data quality over time
- 05Addressing the root causes of poor and inconsistent data
- 06Balancing broad access with security and control
- 07Building a data catalogue and glossary for the organisation
What you will gain
- Explain the purpose and scope of data governance
- Assign data ownership and stewardship roles
- Set standards and definitions for key data
- Measure and monitor data quality
- Address the root causes of poor data
- Balance access with security and control
Who should attend
- Data managers and stewards
- Information and MIS staff
- Compliance and governance personnel
- Anyone responsible for data quality
Upcoming sessions
| Date | City | Duration | Fees | Book |
|---|---|---|---|---|
| 9 to 11 Nov 2026 | Cape Town | 3 Days | R13,000 | |
| 17 to 19 Nov 2026 | Johannesburg | 3 Days | R13,000 | |
| 7 to 9 Dec 2026 | London | 3 Days | US$1,500 | |
| 11 to 13 Jan 2027 | Dubai | 3 Days | US$1,500 | |
| 15 to 17 Feb 2027 | Pretoria | 3 Days | R13,000 | |
| 26 to 28 Apr 2027 | Durban | 3 Days | R13,000 | |
| 28 to 30 Jun 2027 | Cape Town | 3 Days | R13,000 |
Fees are per delegate and exclude VAT. Public intakes are confirmed once minimum numbers are met. We also deliver this course on your own schedule, in-house or live online.
Enquire about this course
Register your team or ask for a tailored in-house quote. We reply within one working day.
WhatsApp usCourse brochure (PDF)- Fees from
- R13,000 per delegate
- Duration
- 3 Days
- Field
- Data & Analytics
- Formats
- In-house, public, online
More in Data & Analytics
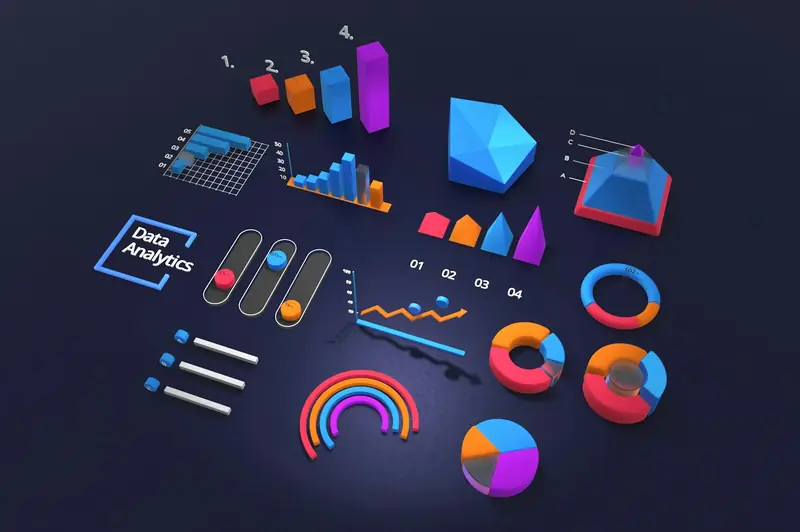
Data Analysis and Visualisation with Excel
Excel remains the most widely used analysis tool in business, and few use it to its full potential. This course takes participants beyond basic formulas into structured analysis, PivotTables, and clear charts that reveal what the numbers mean.
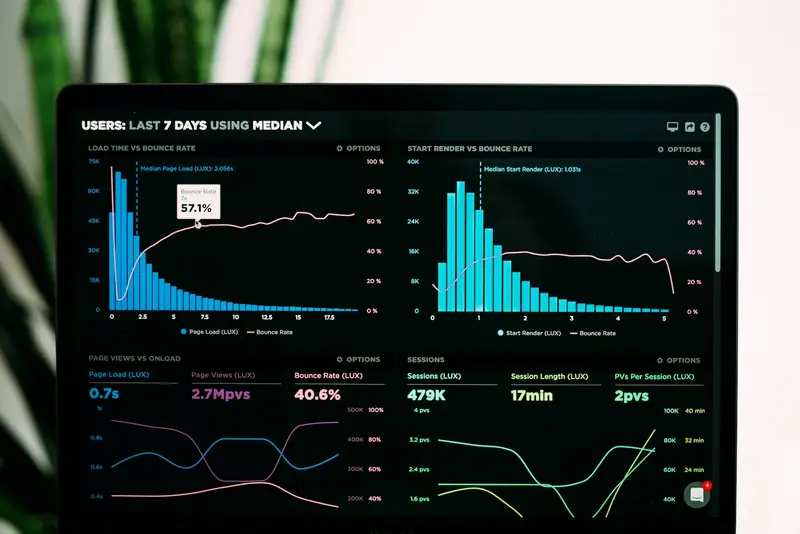
Power BI for Business Intelligence and Reporting
Power BI turns scattered data into interactive reports that decision-makers can explore for themselves. This course guides participants from connecting data sources through building models to publishing dashboards that stay current.
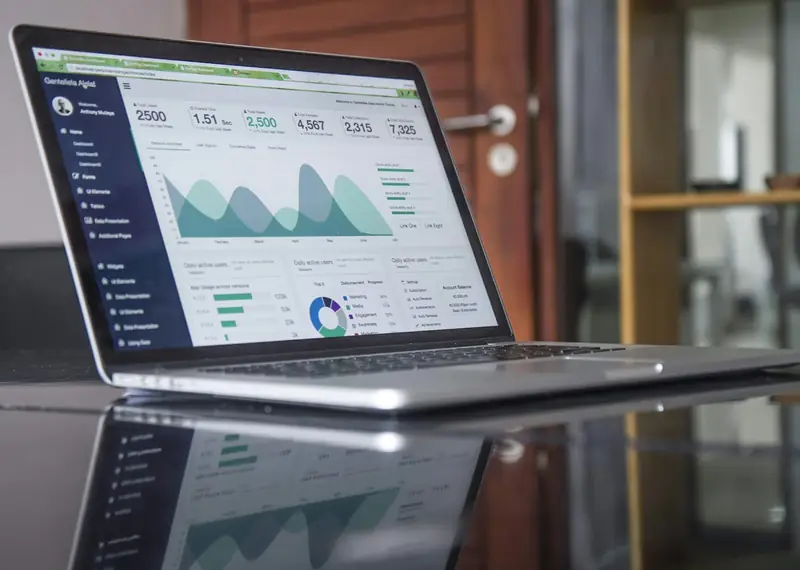
Introduction to Data Analytics for Decision Making
This course demystifies data analytics for professionals who need to use data but are not specialists. Participants learn how to ask the right questions, interpret results, and use evidence to support better decisions.